Where did you get that data?

On the road to good data
Where did you get that?
In my August post entitled ‘On the road to good data! What are Key Performance Indicators? And what do they mean?’ I talked about typical metrics that most insurance brokers use on a daily/monthly basis. I also point out the ‘guiding principles’ that need to be considered before even starting to think about doing some math.
The first guiding principle is determining if the data you are using is reliable and accurate. To figure this out, you must review data in a way that actually structures it in a logical (and easy to understand) way. To do this, we always ask our clients if we can get our hands on some raw data……the conversation usually goes like this:
 Annie: “Would it be possible to get some data from you? If you’re looking for ‘XYZ’ metric, we should look at your production numbers….”
 Broker: “Sure, but do you want the numbers we get from our insurance companies? Or do you want us to try to get something out of our system?”
Annie: “Ideally it’s what’s been transacted in your own BMS – the actual work done by your own employees. Let’s say for a 12-month period – why not Jan 1 to Dec 31 of last year?”
Broker: “Yeah, I think we can get you those numbers.”
Annie: “I need to get that extraction in Excel. Not a PDF. I believe your BMS can extract to Excel.”

![]()

Broker: “ “
Now I apologize to those of you who are offended by the last part of that conversation…but you can’t really do ANYTHING with a PDF. You can look at it…print it up and write on it…. but Excel let’s you create…MAGIC!!!
Data can be extracted from ALL the current popular broker management systems into Excel. If you aren’t sure how to do it, contact your vendor and ask them to show you the report options (or you can just ask me)…
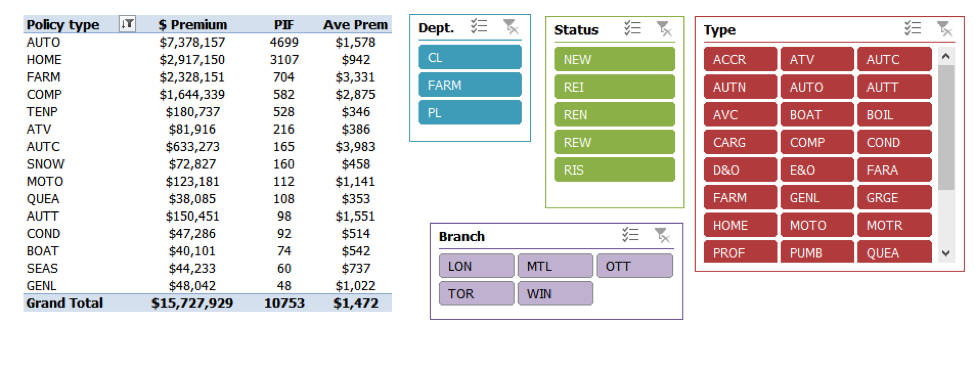
Using your production numbers, you can pivot the data and it will allow you to easily validate the accuracy of what you’ve got. Fun metrics to track with this data are:
- Average policy count per employee (CSR, Producer)
- Premium/revenue volume per employee (CSR, Producer) or product line, as well as average premium/revenue per employee or product line
- Retention (by employee, product line)
Example: distribution of policies by premium or # policies in force
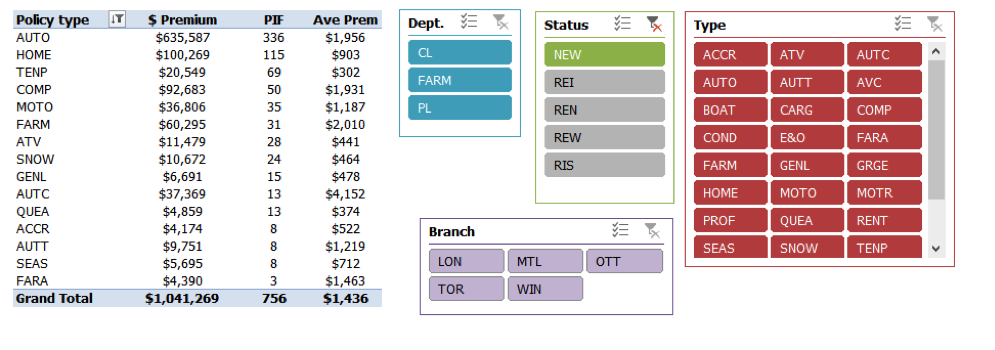
 Or if you want to know what type of Personal Lines new business is being written by your producers (including average premium):
 I’m not going to get into pivot tables in this blog but just Google ‘how do I pivot data in Excel’ and your mind will be blown!
There is one last fun metric that is a favourite of ours…and you can get this from your production data:
Average endorsement revenue
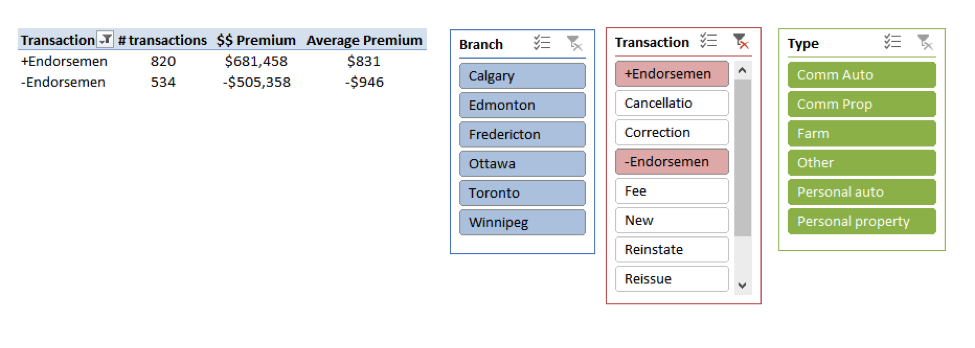 Just think about it. If you total up ALL the endorsements processed and divide it by the number of endorsements transacted (and let’s jack up that number by 25% to account for those $0 endorsements) you can see that your employees are often working (on average) 5 to 10 minutes per transaction to give money back to clients.
 Hopefully that last bit won’t keep you up at night…we’re going to do a blog about it before the end of the year so…
Back to the data
You can also get data from most phone systems. Even if you are not currently recording phone calls, most systems, even basic VOIP systems, offer call logs that you can review by extension number; if your employees are telling you that ‘things are crazy, I’m overwhelmed, the calls just DON’T STOP COMING’ you can validate this by reviewing call activity. These reports are sometimes available in Excel (again, ask your vendor) ….and you can often track:
- # of inbound and outbound calls
- Average duration of each call
- # of ‘transfers’ of calls (calls automatically forwarded)
- # of times calls went to voice mail
As well, call activity can be tracked in a BMS so that audits are easier to perform.
If there is anything you want to know about data sources and the best way to track metrics, let us know!
My next post, ‘Is your data dirty’ will be out by the end of September. As well, Gradient Solutions will be at both the IBAO Convention in October AND the RCCAQ Convention in November so we CHALLENGE YOU to come and see us at our kiosk and ask us anything at all about data and metrics. We are the ‘know-it-all’s of the Canadian Insurance industry so there’s nothing we don’t know!
Efficiency
Modern workflows help you grow.
Learn more
Strategy
Plan your work and work your plan.
Learn more