What are Key Performance Indicators?

On the road to good data
What are Key Performance Indicators?
And what do they mean?
Key Performance indicators (or KPIs for the cool kids) are essentially measurements of ‘something’; the ‘key’ is that the measurement results leave no doubt in your mind about the impact the numbers have on your business. That’s why it’s considered as ‘key’ J; examples from the non-business world could be:
- The pH level of the water in your pool
- LDL and HDL levels of cholesterol
- Batting averages of baseball players
Using the baseball example, Joe’s current batting average is .210 but the team manager feels that if he got more hits, the better their chances at winning the championship. So Joe starts training to become a better hitter so he can bring his average up to .350 and help lead his team to victory! Have you seen the movie ‘Moneyball’? It’s all about analytics, which are forms of KPI’s. Baseball, Brad Pitt and KPIs. Who knew math could be so cool?
In the insurance brokerage space, the three most commonly discussed KPI’s are:
- Retention rates
- Close rates
- Growth rate
These three are essentially the super-heroes of KPI’s if you are an insurance broker. With just these three numbers you can essentially map out the future performance of your book of business.
Before getting too deep, there are a few guiding principles that need to be discussed:
1- Before you can figure out your existing KPI’s you have to first determine if the data you are using is reliable and accurate. A review of the data in Excel and a few comparisons with outside data should give you an indication as to whether your data is ‘clean’ or ‘dirty’.
2- Determine and establish YOUR METHOD of calculating the retention rate and the close rate and see if it will enable you to plot a path to your office’s overall goals. At GSI we have had MANY long “philosophical discussions” with our clients about what goes into each equation.
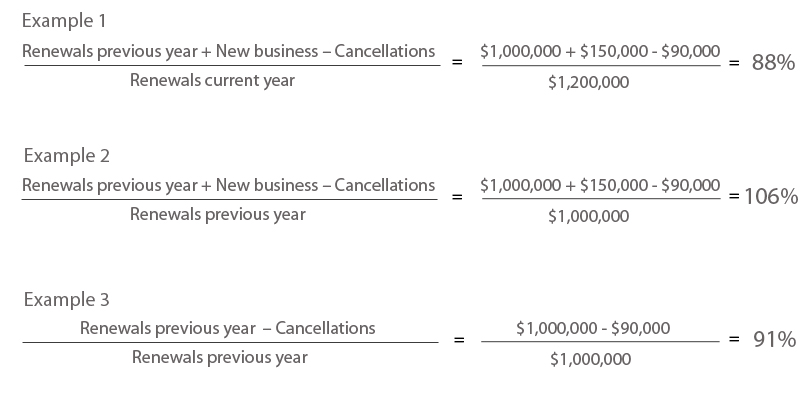
Here are some variations of the Retention calculation that we have seen over the years and the difference in the results:
Basic variables used in these examples:
- Renewals previous year $1,000,000 in GWP
- Renewals current year $1,200,000 in GWP
- New business previous year $150,000 in GWP
- Cancellations previous year $90,000 in GWP
When it comes to calculating the close rate, there is the honest way and then there is the way that it is usually done.
Basic variables used in these examples:
- # quotes sold over the course of one month: 10
- # quotes made in one month: 38
- # quotes where the broker followed up or reached a conclusion with the prospect: 18
- # quotes where the broker didn’t get any feedback or call back: 20
The honest way:
All quotes sold / All quotes made
- 10 / 38 = close rate 26.3%
The usual way:
All quotes sold / All the quotes I bothered to follow up on
- 10 / 18 = close rate 55.5%
One indicator shows that sales training might be a good investment; the other shows that the producer is a rock star. What the complete picture says is that 53% of the quotes made were left on the table (20 / 38) with no conclusion. If each of those quotes took 30 minutes to complete, that’s 10 hours of time spent in a month quoting without generating revenue. If more of those ‘dangling’ quotes were followed up on…well, we’re not just talking rock star…we’re talking Bruce.
3- The indicators as they are today will show you how your business will perform ALL THINGS REMAINING EQUAL. So if you have a 90% retention, a 30% close rate and an average premium of $1000, you can use these numbers to plot out what is going to happen next…if nothing changes.
4- Keep an open-mind about what can impact a KPI – what impacts performance? For example, if I do call 80% of my clients at renewal, will my retention rate go up? If I quote RIGHT AWAY instead of calling a prospect back, will my close rate go up? Are these assumptions or can we actually measure this?
My next two blogs in this KPI series are called ‘Where did you get that?’ and ‘Is your data dirty?’ – we’ll be taking a closer look at ‘the numbers’ and how to check quickly if they make sense…or not…these blogs will be available by the middle of August…so stay tuned!
Watch our video “Determining and measuring your KPIs” with your 30-day FREE trial to 360° Coaching!
Efficiency
Modern workflows help you grow.
Learn more
Strategy
Plan your work and work your plan.
Learn more